“Do we know how much money was spent on project X to date?”
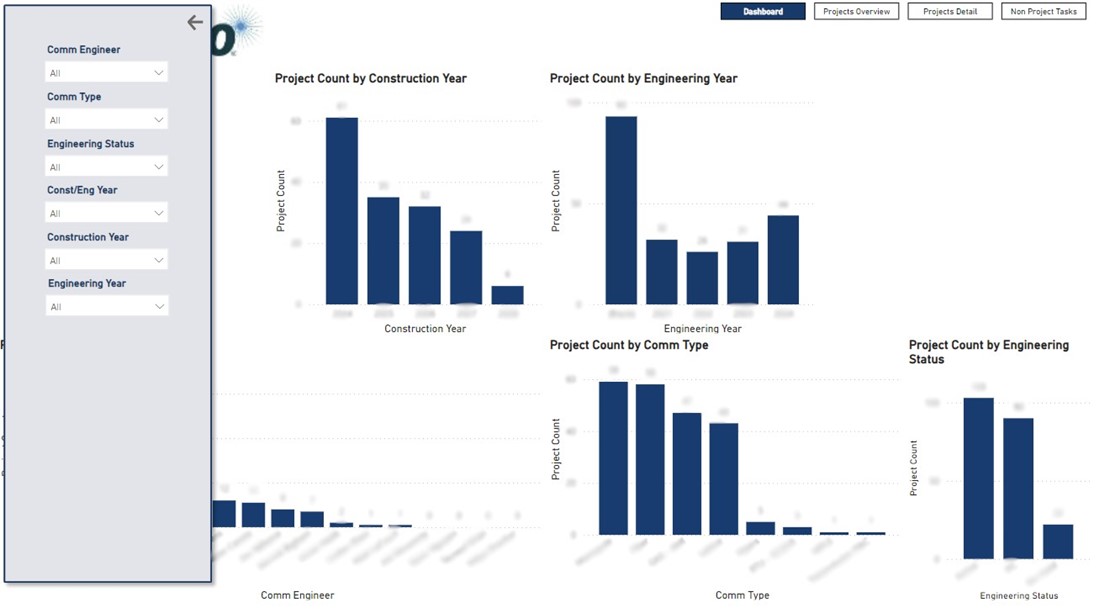
Questions tied to specific projects become difficult to mitigate when managing a portfolio of multiple projects, but this can be better navigated when key metrics are organized into a clear and concise visual dashboard. Dashboards should be the go-to tool for project transparency and alignment. Here’s how PMOs can build a simplified dashboard that serves as a true command center and not just a data dump.
- Highlight Key Metrics Only: Less is more when it comes to data display. Center on metrics that drive decision-making, such as budget status, timeline health, and risk levels. If a metric does not inform an action, consider leaving it out.
- Use Visuals for Quick Insights: Visuals like bar charts, pie graphs, and colored progress bars give a more precise snapshot than blocks of text. Develop a consistent user interface with themed colors that align well and color-coded cues that make it easy to determine that a project needs to be examined more closely.
- Tailor to User Needs: Not everyone needs the same depth. Executives may need a high-level overview, while project leads may want a detailed breakdown. Customizing views based on role keeps dashboards relevant. Meeting with relevant stakeholders early on to develop dashboard requirements can help determine better suitability.
- Automate Real-Time Updates: Real-time updates prevent outdated information, giving everyone the current project status whenever they log in.

A well-designed dashboard saves time, keeps the team aligned, and becomes a vital tool for decision-making. Contact us if you would like to discuss how Mesa’s PMO can help you determine a suitable dashboard to help you and your team manage your next project.
